
Photo by Jingming Pan on Unsplash
Today, the P-value in clinical research is the key statistic for proving the effect of a treatment or the predictability of a biomarker. There is almost no research paper that does not mention the P-value associated with its results. However, the notoriety of this statistic has deteriorated over time and it is now widely criticized by the scientific community, although it is still used in clinical research. We will present here some of the problematic points of this intensive use of the P value.
Before discussing the legitimacy of using P value in clinical trials, let’s start with the basics: What does P-value mean?
On Wikipedia, they define the P value as folows: “In null-hypothesis significance testing, the p-value is the probability of obtaining test results at least as extreme as the result actually observed, under the assumption that the null hypothesis is correct.”
Ok… let’s take a concrete example!
In your clinical development research, one of your candidate treatments has shown in previous experimental phases a positive effect on disease remission and you want to prove it in a larger experiment, e.g in a phase III study.
So you select your target population, your comparator treatment (say, a placebo) and, after conducting the trial, you begin the statistical analysis of the clinical data collected.
In your case, the “null hypothesis” is that your candidate treatment has no particular effect on the disease.
In other words, the clinical data in the treatment arm shows no statistical difference from the data in the placebo arm.
But this is only an hypothesis! You mention it before you start looking at your clinical trial data!
Once you have done the statistical comparison between treatment and placebo using tests like the Student’s t test, chi-square test, etc. you get a standardized measure of the “distance” between the treatment effect and the placebo effect.
Since these measures are standardized, you can see whether the difference is large or small.
In statistics, you would say that you can estimate the probability of getting this difference (or more) between the two treatments just by chance, if in reality there is no clinical difference (i.e. the null hypothesis we mentioned above).
And now yo get it! This probability is called a “P value”.
As a probability, the P value is between [0, 1]
A high P value (close to 1) means that the difference you found is probably due to chance. You have failed to demonstrate that the treatment has any particular clinical efficacy.
If your P value is low (we usually set a threshold at <0.05), then the random explanation is very unlikely, and it seems that your treatment is likely to have a real impact on the disease.
You can easily calculate the p value with some statistical softwares as R, SAS, SPSS etc.. or with other P value calculator tools.
If you have been (or currently are) involved in any kind of clinical research project, you have necessarily been facing the interpretation of the P value in a statistical test.
As a scientific researcher, medical director for a big pharma company, or CEO in a clinical-stage biotech, you probably secretly hoped, from the beginning of your research, to ultimately get the grail of statistical conclusion: ‘The P value is lower than 0.05’.
As a biostatistician in a clinical research team, how often have you had to answer a non-statistician audience with these types of questions: “how to interpret the p-value of a t-test in statistics?”, “what is the meaning of p value?” or “how to find my p value?”
However, although widespread in the pharmaceutical industry, and well accepted in regulatory agencies, the P value is subject to constant and strong criticisms by methodologists’ community.
We will summarize in this here 4 of the issues that are raised against the misuse of P values.
Most of the research projects set the 5% as the significance level cut-off of their analyses.
You have surely been confronted with this type of binary option:
In this case, if you expected any effect, you generally conclude by “These resuts could be due to the small sample size of out cohort, we need to investigate further..”
Let’s go for the publication!
However, it’s important to keep in mind that the famous 5% is not magic, has not been a secret inherited from father to son from ancient Greece. This is essentially an arbitrary criterion!
Even worse, it’s also mean than among 20 clinical studies concluding to a positive treatment effect, probably one study made a “false positive” error, and the treatment has actually no effect…
Some methodologist raised the idea to decrease the significance level to 1%.
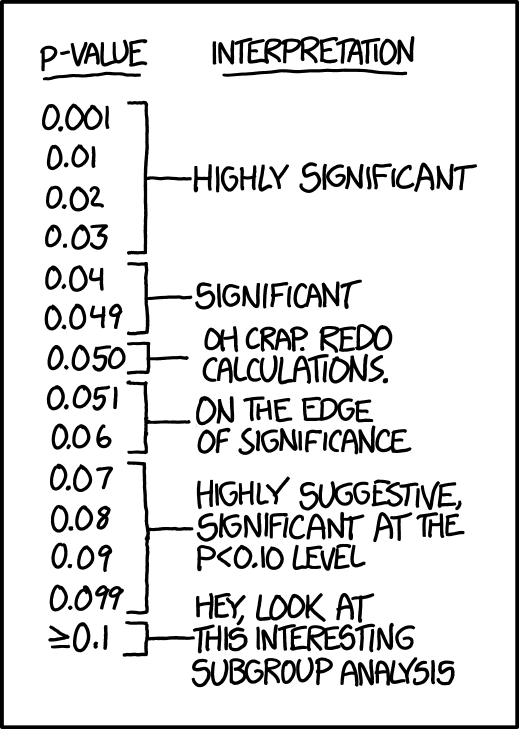
Picture from xkcd
As we mentioned at the beginning of the article, a P value is a probability of claiming a treatment effect when it does not exist in reality (only due to random).
To simplify, a probability can generally be represented by a draw with black and white balls:
When 99% of all the balls in the box are black, the probability that you will draw a white ball from the box on the first draw is very low (actually p=0.01 as you can easily understand)
However, if you retry several times the same draw from this box, it is very likely that you will end up drawing the white ball at least once by chance!
In biostatistics, this problem is called the “Multiplicity of tests”
When many P values of tests are estimated and reported in a same clinical study, the probability to find a p < 0.05 is not 0.05 anymore.
In another words, the probability that the study treatment has no effect is still non-negligible, even if the data you have observed show some effect according to statistical results.
Therefore, we need to be very cautious when we see a list of p value presented in a clinical study report or a research paper.
By the way, statisticians have developed many methodological tools to control this potential bad effect (test corrections etc..). It would be important to learn more about this.
One of the main components of the test statistics is the sample size of the study.
Very briefly, a large sample size increases the precision in the analysis and mechanically increase the likelihood to find a low P-value in a statistical comparison.
In the oppositive way, a small sample size increases the variability within the data and increase the likelihood to find a high P-value (and a conclusion of “no-effect”)
To summarize, the P value does not exclusively report the treatment effect, but is also dependent to external parameters linked to the study design, and the statistical conclusion could be strongly biased by these parameters.
Who talk about a P value, actually talk about its related statistical test.
As you probably know, most of the statistical tests are based on particular data assumption, e.g. normality in data distribution, homoscedasticity, proportional hazards etc.
In addition, there are some conditions of validity for each test needed to be checked before use. (e.g. : more than 5 patients per group for a Chi square test)
Unfortunately, when the tests are performed in a systematic way, these rules are not always respected, and even less reported in the related publications.
Therefore, when the P-value is mentioned without further statistical context, the probability of an erroneous conclusion is not negligeable.
There are many other issues that impact the use of P-value for clinical trial decisions. We will not provide an exhaustive list of all potential statistical limitations here.
However, it is still the primary statistic reported in the medical and clinical literature and it will likely take time to change mindsets and use other types of statistics.
It is still important to be aware of these limitations and to be able to interpret the meaning of the P values in order to draw more accurate conclusions about the results of the studies
Sign up here to enjoy new blog articles about biostatistics, clinical data analytics, and stat programming